| |

NIDES Screen Shots
This page presents
a collection of screen shots that illustrate the features available through
the NIDES administrative interface. The NIDES administrative interface is
written using the MOTIF toolkit to operate under X-Windows. Access
to the various NIDES functions is provided via pulldown menus, point-and-click
selections, and occasional text entry. An extensive multitiered context-sensitive
help system is included. The user interface includes a system monitoring
facility that displays information on monitored systems, the status of
the audit data archiver, an hourly summary of system throughout, and an
hourly summary of alert generation.
(The snapshots provided below were taken from a Windows NT v4.0
Workstation operating as an X11R5 server to a SunOS NIDES host).
| NIDES
Main Window
|
[View Window: Click Here]
The NIDES Main Window comprises two main areas. At the top is a
pulldown menu bar with seven options: setup, monitor, browse,
customize, experiment, quit, and help. The larger part of the
window contains textual information and the NIDES logo. While
you are executing NIDES commands from the menu bar, smaller windows
containing messages or asking questions are displayed on the top of
the Main Window.
|
|
NIDES Setup Menu
|
[View Window: Click Here]
By clicking on the SetUp button on the main window menu, the setup submenu
is activated. This submenu has five options available:
- Analysis:
Starts up and shutdown the NIDES analysis and arpool servers.
- Archiver:
Allows the administrator to build an archival log of events that can later
be analyzed through a Browser interface.
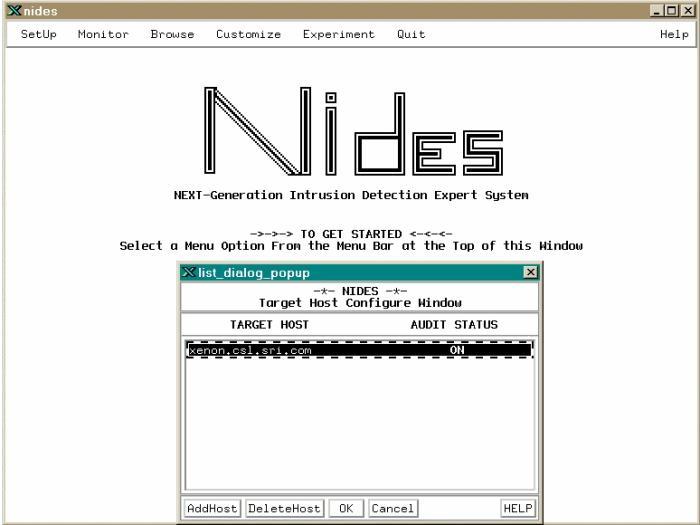
- Target Hosts:
Used to add and remove host computer systems from
the analysis set.
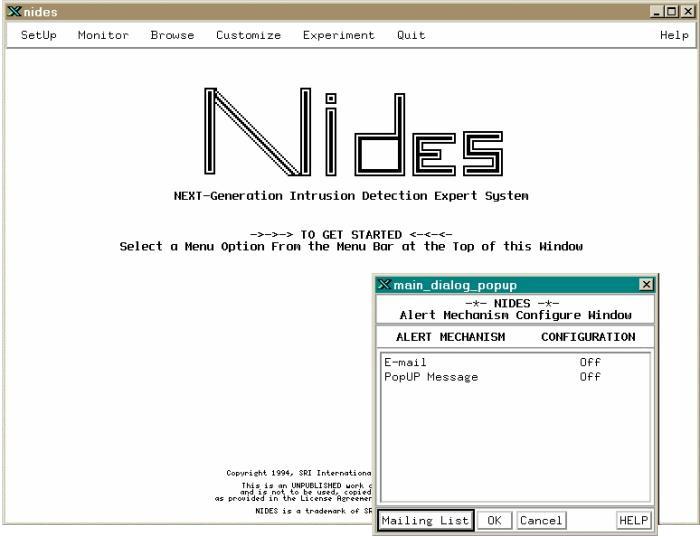
- Alert Method:
Used to specify the method for alerting personnel of critical
events. NIDES supports two methods of alerting: e-mail and PopUP Messages.
This configuration option allows the administrator to build a mailing list of
the users that should be notified as alerts are generated.
- Alert Filter:
Used to configure an alert filter that will
cause NIDES to suppress real-time alert reporting on specific users by type
of alert. Alerts that are filtered out by individuals are not lost, they are
still recorded within a NIDES result archive for later analysis.
|
|
NIDES Monitor Menu
|
[View Window: Click Here]
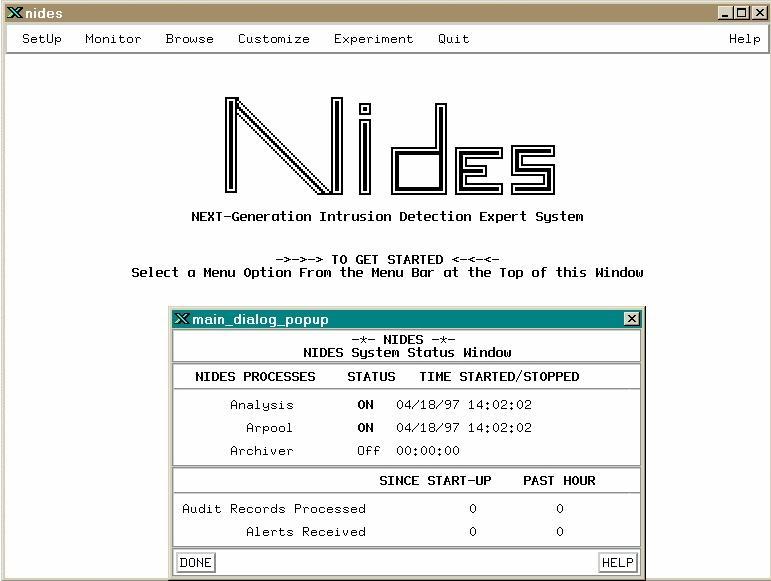
The Monitor Menu contains options that display system and target host status
information. Two options are available under this window. The
System Status Window
displays the status of the NIDES real-time audit data analysis and
intrusion detection functions. The System window provides statistics on the number
of events processed and alters received. In addition, the System window identifies
the current operating state
of the three primary NIDES components that run during real-time analysis:
- Analysis - includes the statistical, rulebased, and resolver
processes.
- Arpool - (audit record pool) coalesces the event streams from the
various host audit generators into a single formatted event stream.
- Archiver - An optional process that archives audit data collected by
arpool.
The Targets option displays status of
all the target hosts that provide real-time audit data to NIDES, regardless of
whether they are currently providing audit data. For each target host, the window
indicates whether the host is currently running an audit generator and whether those
records are being forwarded to the audit record pool, total number of records generated,
the past hour record volume, total number of alerts for the host, and the past hour
alert volume.
|
|
NIDES Browse Menu
|
[View Window: Click Here]
The Browse Menu contains options that support the retrieval of audit and
results data and the review of instance configurations. Audit data
browsing involves the retrieval and display interfaces available within NIDES
to review the audit data archive. From the
Audit Data Browse Window,
the administrator can select the archive to review,
the target subjects of the review, and the time range under review within
the audit log. Once these options are defined, a view option is available to
review the relevant records organized under one of eight different viewing
formats.
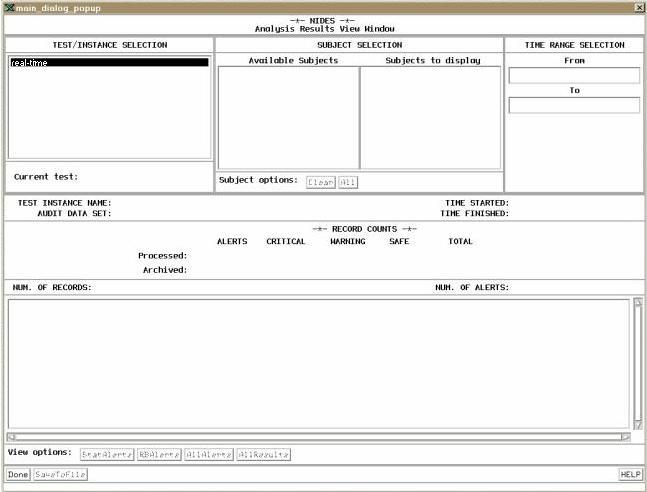
In addition to viewing audit data, the Browse Menu provides options to view
the results from the NIDES
real-time and experimental intrusion detection analyses. The audit stream used to
perform the analysis may be an archive or a real-time audit stream. The subjects
who are the target of the analysis are selected along with a time range selection.
Using the Analysis Results View Menu the administrator can
select the alert viewing option to further specify which records are retrieved
based on the analyses performed:
- StatAlerts - Retrieve only results that were statistical alerts
- RBAlerts - Retrieve only results that were rulebased alerts
- AllAlerts - Retrieve all results that contained any alert, either rulebased,
statistical, or both.
- AllResults - Retrieve all results generated, including both alerts and
nonalerts (e.g., includes non-alert warnings).
|
|
NIDES Customization Menu
|
[View Window: Click Here]
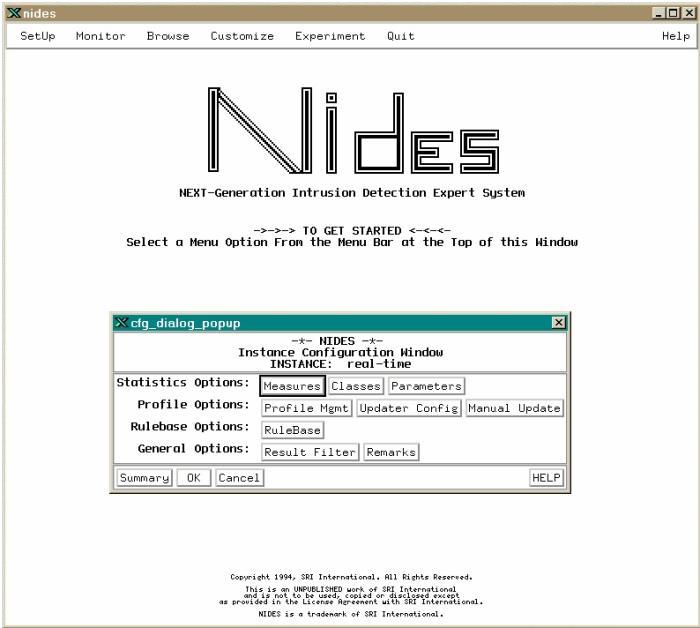
The Customization menu contains options that support the customization
of the NIDES analysis components for real-time operation and experimental
data sets. The Instance Configuration Window, which
applies to both live and test instances, allows the NIDES administrator
to set the available operating parameters for the statistical analysis,
profile management, rulebased analysis, and results filtering.
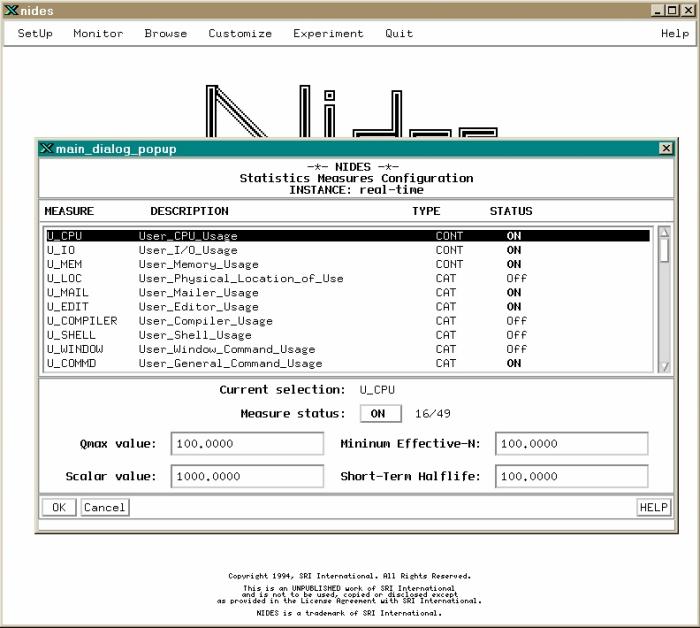
Configuring the statistics component involves configuring the Measures,
Classes, and general analysis parameters for the statistical algorithms.
Using the Measures Configuration Window, the
administrator can configure measures ON or OFF and adjust the parameters
of each measure (Qmax, Scalar, Short-term half-life and Minimum Effective-N).
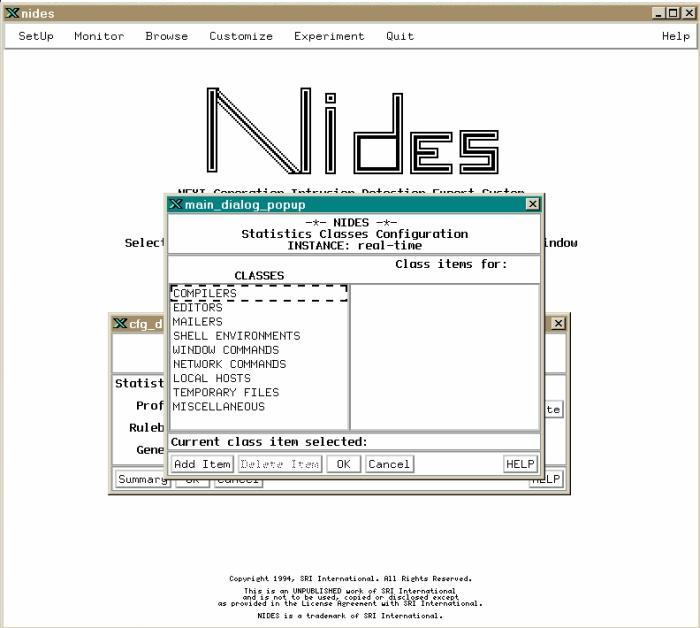
The Classes Configuration Window is used to add and
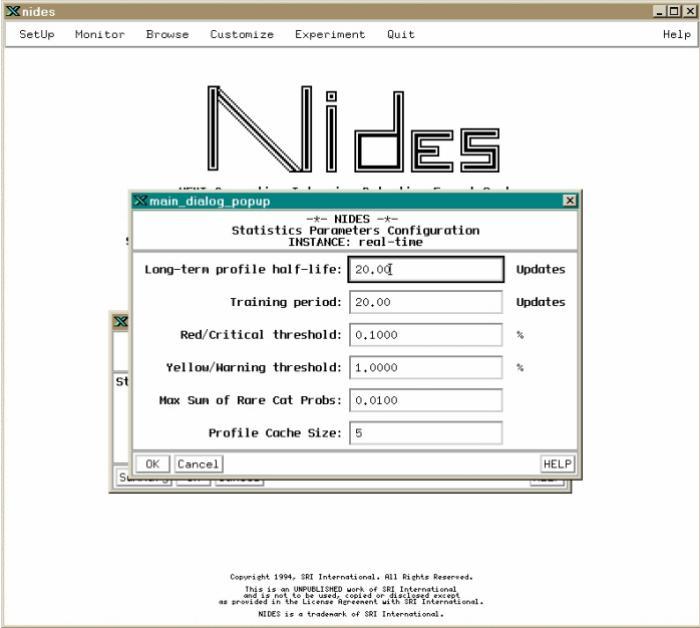
delete members of the eight statistical classes. The
Parameters Windows is used to configure general operating parameters
for the statistical analysis component, including log-term half-life,
training period, threshold settings, and profile cache size.
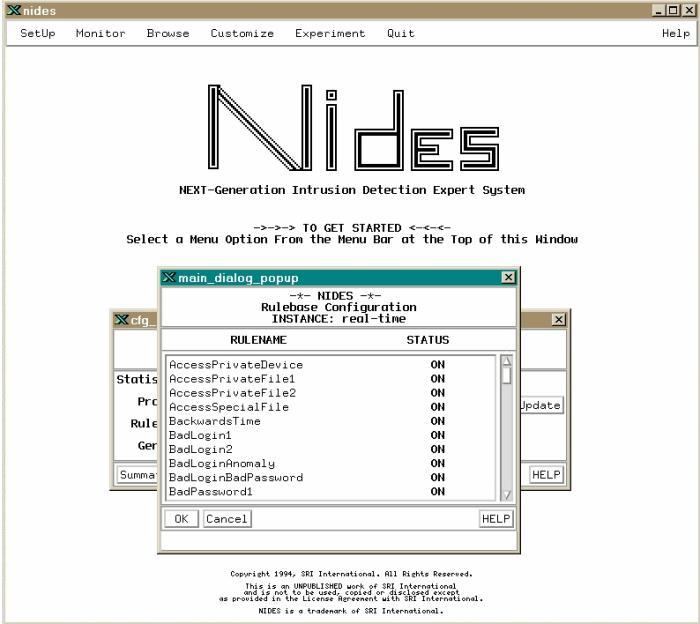
Rule-set enabling and disabling is configured under the
Rulebased Configuration Window. This window
contains a list of the names of the available rule-sets and their current
configuration status (ON or OFF). If the rule is switched ON, it is used
to analyze audit data received by NIDES; otherwise the rule-set is ignored.
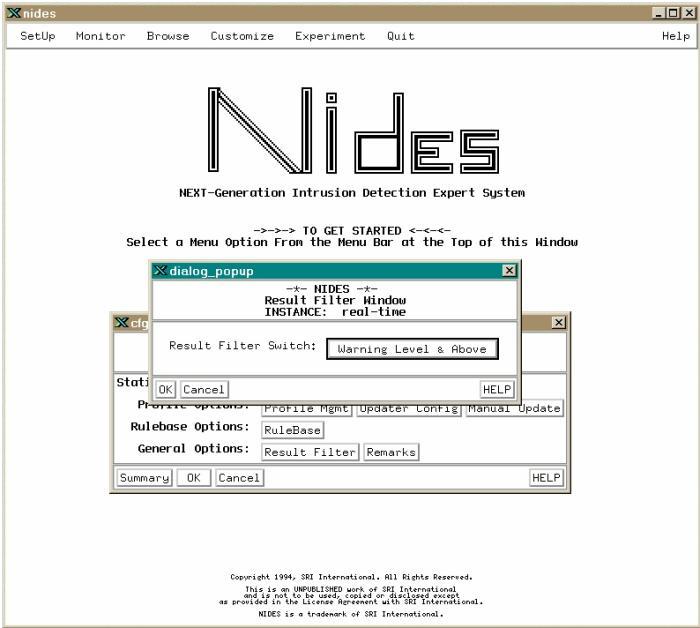
The Results Filtering Window shows the current
results filter setting. A result is generated for every audit record
processed by the NIDES analysis components. Results are categorized into
three levels: safe, warning, and critical. The level of a result is
assigned by the resolver component-based on the levels assigned by the
statistical and rulebased analysis components. A NIDES alert is reported
when the resolver determines that a critical-level result should be
assigned alert status. The Results Filter Window is used to toggle
the filtering status between three possible filter settings:
- Critical Results Only
- Indicates that results at the
critical level will be archived.
- Warning Level and Above
- Indicates that results at the
critical or warning level will be archived.
- All Results
- Indicates that all results generated will
be archived. Since for each audit record processed a result
record is generated, each audit record seen will generate a result
record in the archive.
|
|
NIDES Experiment Menu
|
[View Window: Click Here]
The Experiment Menu contains options that allows the
administrator to run NIDES analysis experiments using test instances
and audit data sets. The SetUp and Exec option initiates NIDES test
runs after you specify the test instance and audit data set. The
Status and Results option displays the status of all NIDES test runs,
both those currently running and those completed.
|
|
|
|
![[View Window: Click Here]](sn1.jpg)
![[View Window: Click Here]](sn2.jpg)
![[View Window: Click Here]](sn3.jpg)
![[View Window: Click Here]](sn4.jpg)
![[View Window: Click Here]](sn5.jpg)
![[View Window: Click Here]](sn6.jpg)
 R&D Divisions