1. IntroductionMechanisms for parsing and filtering hostile external network traffic [2],[4] that could reach internal network services have become widely accepted as prerequisites for limiting the exposure of internal network assets while maintaining interconnectivity with external networks. The encoding of filtering rules for packet- or transport-layer communication should be enforced at entry points between internal networks and external traffic. Developing filtering rules that strike an optimal balance between the restrictiveness necessary to suppress the entry of unwanted traffic, while allowing the necessary flows demanded for user functionality, can be a nontrivial exercise [3]. In addition to intelligent filtering, there have been various developments in recent years in passive surveillance mechanisms to monitor network traffic for signs of malicious or anomalous (e.g., potentially erroneous) activity. Such tools attempt to provide network administrators timely insight into noteworthy exceptional activity. Real-time monitoring promises an added dimension of control and insight into the flow of traffic between the internal network and its external environment. The insight gained through fielded network traffic monitors could also aid sites in enhancing the effectiveness of their firewall filtering rules.
However, traffic monitoring is not a free activity--especially live
traffic monitoring. In presenting our discussion of network analysis
techniques, we fully realize the costs they imply with respect to computational
resources and human oversight. For example, obtaining the necessary input
for surveillance involves the deployment of instrumentation to parse, filter,
and format event streams derived from potentially high-volume packet transmissions.
Complex event analysis, response logic, and human management of the analysis
units also introduce costs. Clearly, the introduction of network
surveillance mechanisms on top of already-deployed protective traffic filters
is an expense that requires justification. In this paper, we outline the
benefits of our techniques and seek to persuade the reader that the costs
can be worthwhile.
2. Toward Generalized Network SurveillanceThe techniques presented in this paper are extensions of earlier work by SRI in developing analytical methods for detecting anomalous or known intrusive activity [1], [5], [12], [13]. Our earlier intrusion-detection efforts in developing IDES (Intrusion Detection Expert System) and later NIDES (Next-Generation Intrusion Detection Expert System) were oriented toward the surveillance of; user-session and host-layer activity. This previous focus on session activity within host boundaries is understandable given that the primary input to intrusion-detection tools, audit data, is produced by mechanisms that tend to be locally administered within a single host or domain. However, as the importance of network security has grown, so too has the need to expand intrusion-detection technology to address network infrastructure and services. In our current research effort, EMERALD (Event Monitoring Enabling Responses to Anomalous Live Disturbances), we explore the extension of our intrusion-detection methods to the analysis of network activity.Network monitoring, in the context of fault detection and diagnosis for computer network and telecommunication environments, has been studied extensively by the network management and alarm correlation community [8], [11], [15], [16]. The high-volume distributed event correlation technology promoted in some projects provides an excellent foundation for building truly scalable network-aware surveillance technology for misuse. However, these efforts focus primarily on the health and status (fault detection and/or diagnosis) or performance of the target network, and do not cover the detection of intentionally abusive traffic. Indeed, some simplifications in the fault analysis and diagnosis community (e.g., assumptions of stateless correlation, which precludes event ordering; simplistic time-out metrics for resetting the tracking of problems; ignoring individuals/sources responsible for exceptional activity) do not translate well to a malicious environment for detecting intrusions. Earlier work in the intrusion-detection community attempting to address the issue of network surveillance includes the Network Security Monitor (NSM), developed at UC Davis [6], and the Network Anomaly Detection and Intrusion Reporter (NADIR) [7], developed at Los Alamos National Laboratory (LANL). Both performed broadcast LAN packet monitoring to analyze traffic patterns for known hostile or anomalous activity.[i] Further research by UC Davis in the Distributed Intrusion Detection System (DIDS) [23] and later Graph-based Intrusion Detection System (GRIDS) [25] projects has attempted to extend intrusion monitoring capabilities beyond LAN analysis, to provide multi-LAN and very large-scale network coverage. This paper takes a pragmatic look at the issue of packet and/or datagram analysis based on statistical anomaly detection and signature-analysis techniques. This work is being performed in the context of SRI's latest intrusion-detection effort, EMERALD, a distributed scalable tool suite for tracking malicious activity through and across large networks [20]. EMERALD introduces a building-block approach to network surveillance, attack isolation, and automated response. The approach employs highly distributed, independently tunable, surveillance and response monitors that are deployable polymorphically at various abstract layers in a large network. These monitors demonstrate a streamlined intrusion-detection design that combines signature analysis with statistical profiling to provide localized real-time protection of the most widely used network services and components on the Internet. Among the general types of analysis targets that EMERALD monitors are network gateways. We describe several analysis techniques that EMERALD implements, and discuss their use in analyzing malicious, faulty, and other exceptional network activity. EMERALD's surveillance modules will monitor entry points that separate external network traffic from an enterprise network and its constituent local domains.[ii] We present these surveillance techniques as complementary to the filtering mechanisms of a large enterprise network, and illustrate their utility in directly enhancing the security and stability of network operations. We first consider the candidate event streams that pass through
network entry points. Critical to the effective monitoring of
operations is the careful selection and organization of these event
streams such that an analysis based on a selected event stream will
provide meaningful insight into the target activity. We identify
effective analytical techniques for processing the event stream given
specific analysis objectives. Sections 4
and 5 explore how both statistical anomaly
detection
and signature analysis can be applied to identify activity worthy of
review and possible response. All such claims are supported by
examples. More broadly, in Section 6
we discuss the
correlation of analysis results produced by surveillance components
deployed independently throughout the entry points of our
protected intranet. We discuss how events of limited significance to
a local surveillance monitor may be aggregated with results from other
strategically deployed monitors to provide insight into more
wide-scale problems or threats against the intranet. Section
7 discusses the issue of response.
3. Event Stream SelectionThe success or failure of event analysis should be quantitatively measured for qualities such as accuracy and performance: both are assessable through testing. A more difficult but equally important metric to assess is completeness. With regard to network surveillance, inaccuracy is reflected in the number of legitimate transactions flagged as abnormal or malicious (false positives), incompleteness is reflected in the number of harmful transactions that escape detection (false negatives), and performance is measured by the rate at which transactions can be processed. All three measurements of success or failure directly depend on the quality of the event stream upon which the analysis is based. Here, we consider the objective of providing real-time surveillance of TCP/IP-based networks for malicious or exceptional network traffic. In particular, our network surveillance mechanisms can be integrated onto, or interconnected with, network gateways that filter traffic between a protected intranet and external networks.IP traffic represents an interesting candidate event stream for analysis. Individually, packets represent parsable activity records, where key data within the header and data segment can be statistically analyzed and/or heuristically parsed for response-worthy activity. However, the sheer volume of potential packets dictates careful assessment of ways to optimally organize packets into streams for efficient parsing. Thorough filtering of events and event fields such that the target activity is concisely isolated, should be applied early in the processing stage to reduce resource utilization. With respect to TCP/IP gateway traffic monitoring, we have investigated a variety of ways to categorize and isolate groups of packets from an arbitrary packet stream. Individual packet streams can be filtered based on different isolation criteria, such as
4. Traffic Analysis with Statistical Anomaly DetectionSRI has been involved in statistical anomaly-detection research for over a decade [1], [5], [10]. Our previous work focused on the profiling of user activity through audit-trail analysis. Within the EMERALD project, we are extending the underlying statistical algorithms to profile various aspects of network traffic in search of response- or alert-worthy anomalies.The statistical subsystem tracks subject activity via one or more variables called measures. The statistical algorithms employ four classes of measures: categorical, continuous, intensity, and event distribution. Categorical measures are those that assume values from a categorical set, such as originating host identity, destination host, and port number. Continuous measures are those for which observed values are numeric or ordinal, such as number of bytes transferred. Derived measures also track the intensity of activity (that is, the rate of events per unit time) and the ``meta-distribution'' of the measures affected by recent events. These derived measure types are referred to as intensity and event distribution. The system we have developed maintains and updates a description of a subject's behavior with respect to these measure types in a compact, efficiently updated profile. The profile is subdivided into short- and long-term elements. The short-term profile accumulates values between updates, and exponentially ages values for comparison to the long-term profile. As a consequence of the aging mechanism, the short-term profile characterizes the recent activity of the subject, where ``recent'' is determined by the dynamically configurable aging parameters used. At update time (typically, a time of low system activity), the update function folds the short-term values observed since the last update into the long-term profile, and the short-term profile is cleared. The long-term profile is itself slowly aged to adapt to changes in subject activity. Anomaly scoring compares related attributes in the short-term profile against the long-term profile. As all evaluations are done against empirical distributions, no assumptions of parametric distributions are made, and multi-modal and categorical distributions are accommodated. Furthermore, the algorithms we have developed require no a priori knowledge of intrusive or exceptional activity. A more detailed mathematical description of these algorithms is given in [9], [26]. Our earlier work considered the subject class of users of a computer system and the corresponding event stream the system audit trail generated by user activity. Within the EMERALD project, we generalize these concepts so that components and software such as network gateways, proxies, and network services can themselves be made subject classes. The generated event streams are obtained from log files, packet analysis, and--where required--special-purpose instrumentation made for services of interest (e.g., FTP, HTTP, or SMTP). As appropriate, an event stream may be analyzed as a single subject, or as multiple subjects, and the same network activity can be analyzed in several ways. For example, an event stream of dropped packets permits analyses that track the reason each packet was rejected. Under such a scenario, the firewall rejecting the packet is the subject, and the measures of interest are the reason the packet was dropped (a categorical measure), and the rate of dropped packets in the recent past (one or more intensity measures tuned to time intervals of seconds to minutes). Alternatively, these dropped packets may be parsed in finer detail, supporting other analyses where the subject is, for example, the identity of the originating host. EMERALD can also choose to separately define satellite offices and ``rest of world'' as different subjects for the same event stream. That is, we expect distinctions from the satellite office's use of services and access to assets to deviate widely from sessions originating from external nonaffiliated sites. Through satellite session profiling, EMERALD can monitor traffic for signs of unusual activity. In the case of the FTP service, for example, each user who gives a login name is a subject, and ``anonymous'' is a subject as well. Another example of a subject is the network gateway itself, in which case there is only one subject. All subjects for the same event stream (that is, all subjects within a subject class) have the same measures defined in their profiles, but the internal profile values are different. As we migrate our statistical algorithms that had previously focused on user audit trails with users as subjects, we generalize our ability to build more abstract profiles for varied types of activity captured within our generalized notion of an event stream. In the context of statistically analyzing TCP/IP traffic streams, profiling can be derived from a variety of traffic perspectives, including profiles of
Event records are generated either as a result of activity or at periodic intervals. In our case, activity records are based on the content of IP packets or transport-layer datagrams. Our event filters also construct interval summary records, which contain accumulated network traffic statistics (at a minimum, number of packets and number of kilobytes transferred). These records are constructed at the end of each interval (e.g., once per N seconds). EMERALD's statistical algorithm adjusts its short-term profile for the measure values observed on the event record. The distribution of recently observed values is evaluated against the long-term profile, and a distance between the two is obtained. The difference is compared to a historically adaptive, subject-specific deviation. The empirical distribution of this deviation is transformed to obtain a score for the event. Anomalous events are those whose scores exceed a historically adaptive, subject-specific score threshold based on the empirical score distribution. This nonparametric approach handles all measure types and makes no assumptions on the modality of the distribution for continuous measures.
The following sections provide example scenarios of exceptional
network activity that can be measured by an EMERALD statistical
engine deployed to network gateways.
4.1 Categorical Measures in Network TrafficCategorical measures assume values from a discrete, nonordered set of possibilities. Examples of categorical measures include
The statistical component builds empirical distributions of the category values encountered, even if the list of possible values is open-ended, and has mechanisms for ``aging out'' categories whose long-term probabilities drop below a threshold.
The following is an example of categorical measures used in the
surveillance of proxies for services such as SMTP or FTP. Consider a
typical data-exchange sequence between an external
client and an internal server within the protected network. Anonymous
FTP is restricted to certain files and directories; the names of these
are categories for measures pertaining to file/directory reads and (if
permitted) writes. Attempted accesses to unusual directories appear
anomalous. Monitors dedicated to ports include a categorical measure
whose values are the protocol used. Invalid requests often lead to an
access violation error; the type of error associated with a request is
another example of a categorical measure, and the count or rate of
errors in the recent past is tracked as continuous measures, as
described in Section
4.2 Continuous Measures in Network TrafficContinuous measures assume values from a continuous or ordinal set. Examples include inter-event time (difference in time stamps between consecutive events from the same stream), counting measures such as the number of errors of a particular type observed in the recent past, and network traffic measures (number of packets and number of kilobytes). The statistical subsystem treats continuous measures by first allocating bins appropriate to the range of values of the underlying measure, and then tracking the frequency of observation of each value range. In this way, multi-modal distributions are accommodated and much of the computational machinery used for categorical measures is shared.Continuous measures are useful not only for intrusion detection, but also support the monitoring of health and status of the network from the perspective of connectivity and throughput. An instantaneous measure of traffic volume maintained by a gateway monitor can detect a sudden and unexpected loss in the data rate of received packets, when this volume falls outside historical norms for the gateway. This sudden drop is specific both to the gateway (the subject, in this case) and to the time of day (e.g., the average sustained traffic rate for a major network artery is much different at 11:00 a.m. than at midnight). In our example discussion of an FTP service in Section 4.1, attempts to access unallowed directories or files result in errors. The recently observed rate of such errors is continuously compared with the rate observed over similar time spans for other FTP sessions. Some low rate of error due to misspellings or innocent attempts is to be expected, and this would be reflected in the historical profile for these measures. An excess beyond historical norms indicates anomalous activity. Continuous measures can also work in conjunction with categorical measures to detect excessive data transfers or file uploads, or excessive mail relaying, as well as excessive service-layer errors by external clients. Categorical and continuous measures have proven to be the most useful for anomaly detection in a variety of contexts.
We next describe the two derived measure types, intensity and
event distribution, which detect anomalies related to recent traffic
volume and the mix of measures affected by this traffic.
4.3 Measuring Network Traffic IntensityIntensity measures distinguish whether a given volume of traffic appears consistent with historical observations. These measures reflect the intensity of the event stream (number of events per unit time) over time intervals that are tunable. Typically, we have defined three intensity measures per profile, which, with respect to user activity monitoring, were scaled at intervals of 60 seconds, 600 seconds, and 1 hour. Applied to raw event streams, intensity measures are particularly suited for detecting flooding attacks, while also providing insight into other anomalies.EMERALD uses volume analyses to help detect the introduction of malicious traffic, such as traffic intended to cause service denials or perform intelligence gathering, where such traffic may not necessarily be violating filtering policies. A sharp increase in the overall volume of discarded packets, as well as analysis of the disposition of the discarded packets (as discussed in Section 4.1, can provide insight into unintentionally malformed packets resulting from poor line quality or internal errors in neighboring hosts. High volumes of discarded packets can also indicate more maliciously intended transmissions such as scanning of UPD ports or IP address scanning via ICMP echoes. Excessive numbers of mail expansion requests (EXPN) may indicate intelligence gathering, perhaps by spammers. These and other application-layer forms of doorknob rattling can be detected by an EMERALD statistical engine when filtering is not desired. Alternatively, a sharp increase in events viewed across longer durations may provide insight into a consistent effort to limit or prevent successful traffic flow. Intensity measures of transport-layer connection requests, such as a volume analysis of SYN-RST messages, could indicate the occurrence of a SYN-attack [17] against port availability (or possibly for port scanning). Variants of this could include intensity measures of TCP/FIN messages [14], considered a more stealthy form of port scanning.
Monitoring overall traffic volume and bursty events by using both
intensity and continuous measures provides some interesting advantages
over other monitoring approaches, such as user-definable heuristic rules
that specify fixed thresholds. In particular, the
intensity of events over a duration is relative in the sense that the
term ``high volume'' may reasonably be considered different at
midnight than at 11:00 a.m. The notion of high bursts of events might
similarly be unique to the role of the target system in the intranet
(e.g., web server host versus a user workstation). Rule developers
would need to carefully define thresholds based on many factors unique
to the target system. On the other hand, the statistical algorithms
would, over time, build a target-specific profile that could evaluate
event intensity for the given system over a variety of time slices
such as the time of day (e.g., business hours versus afterhours)
and/or day of the week (e.g., weekday versus weekend).
4.4 Event Distribution MeasuresThe event-distribution measure is a meta-measure that monitors which other measures in the profile are affected by each event. For example, an ls command in an FTP session affects the directory measure, but does not affect measures related to file transfer. This measure is not interesting for all event streams. For example, all network-traffic event records affect the same measures (number of packets and kilobytes) defined for that event stream, so the event distribution does not change.
On the other hand, event-distribution measures are useful in
correlative analysis achieved via the ``Monitor of Monitors''
approach. Here, each monitor contributes to an aggregate event stream
for the domain of the correlation monitor. These events are generated
only when the individual monitor decides that the recent behavior is
anomalous (though perhaps not sufficiently anomalous by itself to
trigger a declaration). Measures recorded include time stamp, monitor
identifier, subject identifier, and measure identities of the most
outlying measures. Overall intensity of this event stream may be
indicative of a correlated attack. The distribution of which monitors
and which measures are anomalous is likely to be different with an
intrusion or malfunction than with the normal ``innocent exception.''
(See Section 6 for a further discussion on
result correlation.)
4.5 Statistical Session AnalysisStatistical anomaly detection via the methods described above enables EMERALD to answer questions such as how the current anonymous FTP session compares to the historical profile of all previous anonymous FTP sessions. Mail exchange could be similarly monitored for atypical exchanges (e.g., excessive mail relays).
Continuing with the example of FTP, we assign FTP-related events to a
subject (the login user or ``anonymous''). As several sessions may be
interleaved, we maintain separate short-term profiles for each, but
may score against a common long-term profile (for example, short-term
profiles are maintained for each ``anonymous'' FTP session, but each
is scored against the historical profile of ``anonymous'' FTP
sessions). The aging mechanism in the statistics module allows it to
monitor events either as the events occur or at the end of the
session. We have chosen the former approach (analyze events as they
happen), as it potentially detects anomalous activity in a session
before that session is concluded.
5. Traffic Analyzing with Signature AnalysisSignature analysis is a process whereby an event stream is mapped against abstract representations of event sequences known to indicate the target activity of interest. Signature engines are essentially expert systems whose rules fire as event records are parsed that appear to indicate suspicious, if not illegal, activity. Signature rules may recognize single events that by themselves represent significant danger to the system, or they may be chained together to recognize sequences of events that represent an entire penetration scenario.However, simplistic event-to-rule binding alone does not necessarily provide enough indication to ensure accurate detection of the target activity. Signature analyses must also distinguish whether an event sequence being witnessed is actually transitioning the system into the anticipated compromised state. In addition, determining whether a given event sequence is indicative of an attack may be a function of the preconditions under which the event sequence is performed. Example coding schemes for representing operating system penetrations through audit trail analysis are [12], [18], [19]. Using basic signature-analysis concepts, EMERALD can support a variety of analyses involving packet and transport datagrams as event streams. For example, address spoofing, tunneling, source routing [21], SATAN [27] attack detection, and abuse of ICMP messages (Redirect and Destination Unreachable} messages in particular) [4] could all be encoded and detected by signature engines that guard network gateways. The heuristics for analyzing headers and application datagrams for some of these abuses are not far from what is already captured by some filtering tools. In fact, it is somewhat difficult to justify the expense of passively monitoring the traffic stream for such activity when one could turn such knowledge into filtering rules.[iv] Regardless, there still remain several examples that help justify the expense of employing signature analyses to monitor network traffic. In particular, there are points where the appearance of certain types of legitimate traffic introduces questions regarding the motives of the traffic source. Distinguishing benign requests from illicit ones may be fairly difficult, and such questions are ultimately site-specific. For example, EMERALD surveillance modules can encode thresholds to monitor activity such as the number of fingers, pings, or failed login requests to accounts such as guest, demo, visitor, anonymous FTP, or employees who have departed the company. Threshold analysis is a rudimentary, inexpensive technique that records the occurrence of specific events and, as the name implies, detects when the number of occurrences of that event surpasses a reasonable count. In addition, we are developing heuristics to support the processing of application-layer transactions derived from packet monitoring. EMERALD's signature analysis module can sweep the data portion of packets in search of a variety of transactions that indicate suspicious, if not malicious, intentions by the external client. While traffic filtering rules may allow external traffic through to an internally available network service, signature analysis offers an ability to model and detect transaction requests or request parameters, alone or in combination, that are indicative of attempts to maliciously subvert or abuse the internal service. EMERALD's signature engine, for example, is capable of real-time parsing of FTP traffic through the firewall or router for unwanted transfers of configuration or specific system data, or anonymous requests to access non-public portions of the directory structure. Similarly, EMERALD can analyze anonymous FTP sessions to ensure that the file retrievals and uploads/modifications are limited to specific directories. Additionally, EMERALD's signature analysis capability is being extended to session analyses of complex and dangerous, but highly useful, services like HTTP or Gopher.
Another interesting application of signature analysis is the scanning
of traffic directed at high-numbered unused ports (i.e., ports to which
the administrator has not assigned a network service). Here, datagram
parsing can be used to study network traffic after some threshold
volume of traffic, directed at an unused port, has been exceeded.
A signature module can employ a knowledge base of known telltale
datagrams that are indicative of well-known network-service protocol
traffic (e.g., FTP, Telnet, SMTP, HTTP). The signature module then
determines whether the unknown port traffic matches any known datagram
sets. Such comparisons could lead to the discovery of network
services that have been installed without an administrator's
knowledge.
6. Composable Surveillance of Network TrafficThe focus of surveillance need not be limited to the analysis of traffic streams through a single gateway. An extremely useful extension of anomaly detection and signature analyses is to support the hierarchical correlation of analysis results produced by multiple distributed gateway surveillance modules. Within the EMERALD framework, we are developing meta-surveillance modules that analyze the anomaly and signature reports produced by individual traffic monitors dispersed to the various entry points of external traffic into local network domains.
This concept is illustrated in Figure 1,
which depicts an example enterprise network consisting of interconnected
local network domains.[v] These local domains are independently
administered, and could perhaps correspond to the division of
computing assets among departments within commercial organizations or
independent laboratories within research organizations. In this
figure, connectivity with the external world is provided through one
or more service providers (SP1 and SP2), which may provide a limited
degree of filtering based on source address (to avoid address
spoofing), as well as other primitive checks such as monitoring
checksum.
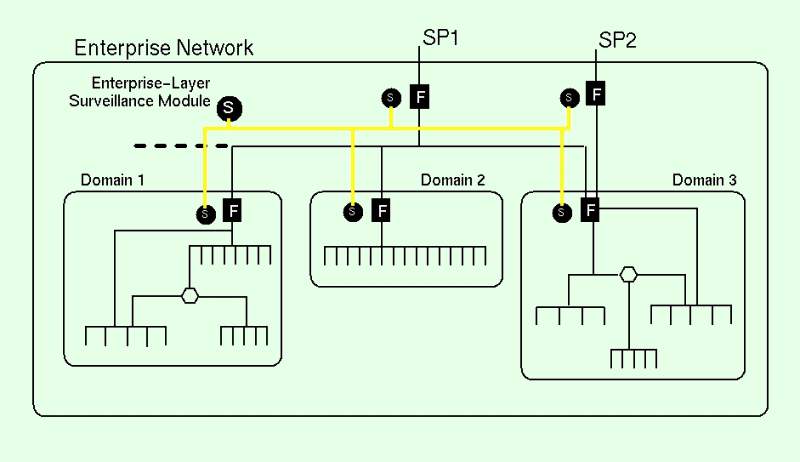 Inside the perimeter of the enterprise, each local domain maintains its traffic filtering control (F-boxes) over its own subnetworks. These filters enforce domain-specific restriction over issues such as UDP port availability, as well as acceptable protocol traffic. EMERALD surveillance monitors are represented by the S-circles, and are deployed to the various entry points of the enterprise and domains. EMERALD surveillance modules develop analysis results that are then directed up to an enterprise-layer monitor, which correlates the distributed results into a meta-event stream. The enterprise monitor is identical to the individual gateway monitors (i.e., they use the same code base), except that it is configured to correlate activity reports produced by the gateway monitors. The enterprise monitor employs both statistical anomaly detection and signature analyses to further analyze the results produced by the distributed gateway surveillance modules, searching for commonalities or trends in the distributed analysis results.
The following sections focus on aggregate analyses that may induce both
local response and/or enterprise-wide response. We enumerate some of
the possible ways that analysis results from the various surveillance
modules can be correlated to provide insight into more global problems
not visible from the narrow perspective of local entry-point monitoring.
6.1 Commonalities among ResultsOne issue of direct interest is whether there exist commonalities in analysis results across surveillance modules that are examining mutually exclusive event streams. For example, a scenario previously discussed was that of a statistical engine observing a drastic increase in the number of discarded packets at the entry point to a domain, perhaps even observing the majority cause for packet discards. Depending on the degree of increase, a local domain administrator could be persuaded to take actions to help alleviate or remove the cause of the failed packets. However, if on a given day all such domains throughout the enterprise similarly observed marked increases in discarded packet volume, the response could propagate from being a local concern to being an enterprise-wide issue. Similarly, commonalities across domains in excessive levels of protocol-specific errors or signature engines detecting unwanted activity across multiple domains could lead to enterprise-layer responses.We might also choose to distinguish excessive types of certain traffic in an effort to check for intelligence gathering by outsiders who submit requests such as finger, echo, or mail alias expansion, to multiple domains in the enterprise (i.e., round-robin doorknob rattling). The objective of such a technique might be to avoid detection from both local network intensity and/or continuous measures by spreading out the probes to multiple independently monitored domains. Through aggregate analysis, we could maintain the enterprise-wide profile of probes of this type, and detect when an unusual number or mix of these probes occurs. While such probes may not appear excessive from the local domain perspective, the enterprise overall may observe a marked increase worthy of response.
In addition, we can add a layer of traffic-rate monitoring by
profiling the overall volume of enterprise traffic expected throughout
various slices of the day and week. Local monitors may use continuous
measures to detect drastic declines in packet volumes that could
indicate transmission loss or serious degradation. However, it is
conceivable that the degradation from the local domain perspective,
while significant, is not drastic enough to warrant active response.
At the same time, we may find through results correlation that the
aggregate of all domains producing reports of transmission rate
degradation during the same time period could warrant attention at the
enterprise layer. Thus, local domain activity below the severity of
warranting a response could in aggregation with other activity be
found to warrant a response.
6.2 Sequential Trend AnalysisOf general use to meta-surveillance is the modeling of activity for sequential trends in the appearance of problematic traffic. For example, this could entail correlating the analyses of local monitors, looking for trends in the propagation of application-layer datagrams for error or ICMP packets. While local responses to error messages could be handled by the local domain administrators, reports of errors spreading across all domains might more effectively be addressed by those responsible for connections between the enterprise and the service provider.Attacks repeated against the same network service across multiple domains can also be detected through enterprise-layer correlation. For example, multiple surveillance modules deployed to various local domains in the enterprise might begin to report, in series, suspicious activity observed within sessions employing the same network service. Such reports could lead to enterprise-layer responses or warnings to other domains that have not yet experienced or reported the session anomalies. In this sense, results correlation enables the detection of spreading attacks against a common service, which first raise alarms in one domain, and gradually spread domain by domain to affect operations across the enterprise.
We are studying the use of
fault-relationship models [22], in which recognition of
a problem in one network component (e.g., loss of connectivity or
responsiveness) could propagate as different problems in neighboring
hosts (e.g., buffer overflows or connection timeout due to overloads).
Our enterprise monitor employs rule-based heuristics to capture such
relationship models.
7. Response HandlingOnce a problem is detected, the next challenge is to formulate an effective response. In many situations, the most effective response may be no response at all, in that every response imposes some cost in system performance or (worse) human time. The extent to which a decision unit contains logic to filter out uninteresting analysis results may mean the difference between effective monitoring units and unmanageable (soon to be disabled) monitoring units. For certain analysis results such as the detection of known hostile activity through signature analyses, the necessity for response invocation may be obvious. For other analysis results such as anomaly reports, response units may require greater sophistication in the invocation logic.Fundamental to effective response handling is the accurate identification of the source responsible for the problem. However, unlike audit-trail analysis where event-record fields such as the subject ID are produced by the OS kernel, attackers have direct control over the content and format of packet streams. Packet forgery is straightforward, and one must take care to avoid allowing attackers to manipulate response logic to harm legitimate user connectivity or cause service denials throughout the network. Some techniques have been proposed to help track network activity to the source [24]. Another issue is how to tailor a response that is appropriate given the severity of the problem, and that provides a singular effect to address the problem without harming the flow of legitimate network traffic. Countermeasures range from very passive responses, such as passive results dissemination, to highly aggressive actions, such as severing a communication channel. Within EMERALD, our response capabilities will employ the following general forms of response:
8. ConclusionWe have described event-analysis techniques developed in the intrusion-detection community, and discussed their application to monitoring TCP/IP packet streams through network gateways. We present a variety of exceptional activity (both malicious and nonmalicious) to which these analysis techniques could be applied. Table 1 summarizes the analyzable exceptional network activity presented in this paper, and identifies which method (statistical anomaly detection, signature analysis, or hierarchical correlation) can be utilized to detect the activity. These examples help to justify the expense of gateway surveillance monitors, even in the presence of sophisticated traffic-filtering mechanisms. Indeed, several of the example forms of ``interesting traffic'' listed in Table 1 are not easily, if at all, preventable using filtering mechanisms. In addition, our surveillance modules may even help to tune or point out mistakes in filtering rules that could lead to the accidental discarding of legitimate traffic. The surveillance modules may detect the occurrence of traffic that appears to be anomalous or abusive, regardless of whether the traffic is allowed to enter, or is prevented from entering, through the network gateway. Furthermore, these techniques may extend to nonmalicious problem detection such as failures in neighboring systems.
While this paper is intended to justify and illustrate the
complementary nature of combining surveillance capabilities with
filtering mechanisms, in future research we will explore the practical
aspects of monitor deployment, including performance analysis and
secure integration into supporting network infrastructure (e.g.,
network management). Perhaps even more than traditional audit-based
intrusion-detection developers, network monitor developers must
carefully assess the optimum ways to organize and isolate the relevant
traffic from which their analyses are based. The added dimension of
control and insight into network operations gained by well-integrated
surveillance modules is well worth consideration.
Endnotes
References
|